
目錄:
由於日本的南北狹長地形,可以分為六個氣候帶,從亞熱帶到涼溫帶,因此沒有統一的最佳日本旅行季節。梅雨季、高濕度和颱風與西伯利亞冷風同樣影響著日本的氣候。所以,何時最適合旅遊,完全取決於你喜歡什麼溫度、想在日本體驗什麼。
為了清楚明瞭,我們將六個氣候帶統整為三大區域:
- 北海道及本州北部
- 中央日本(東京、大阪、京都周邊)
- 本州南部與沖繩合併區
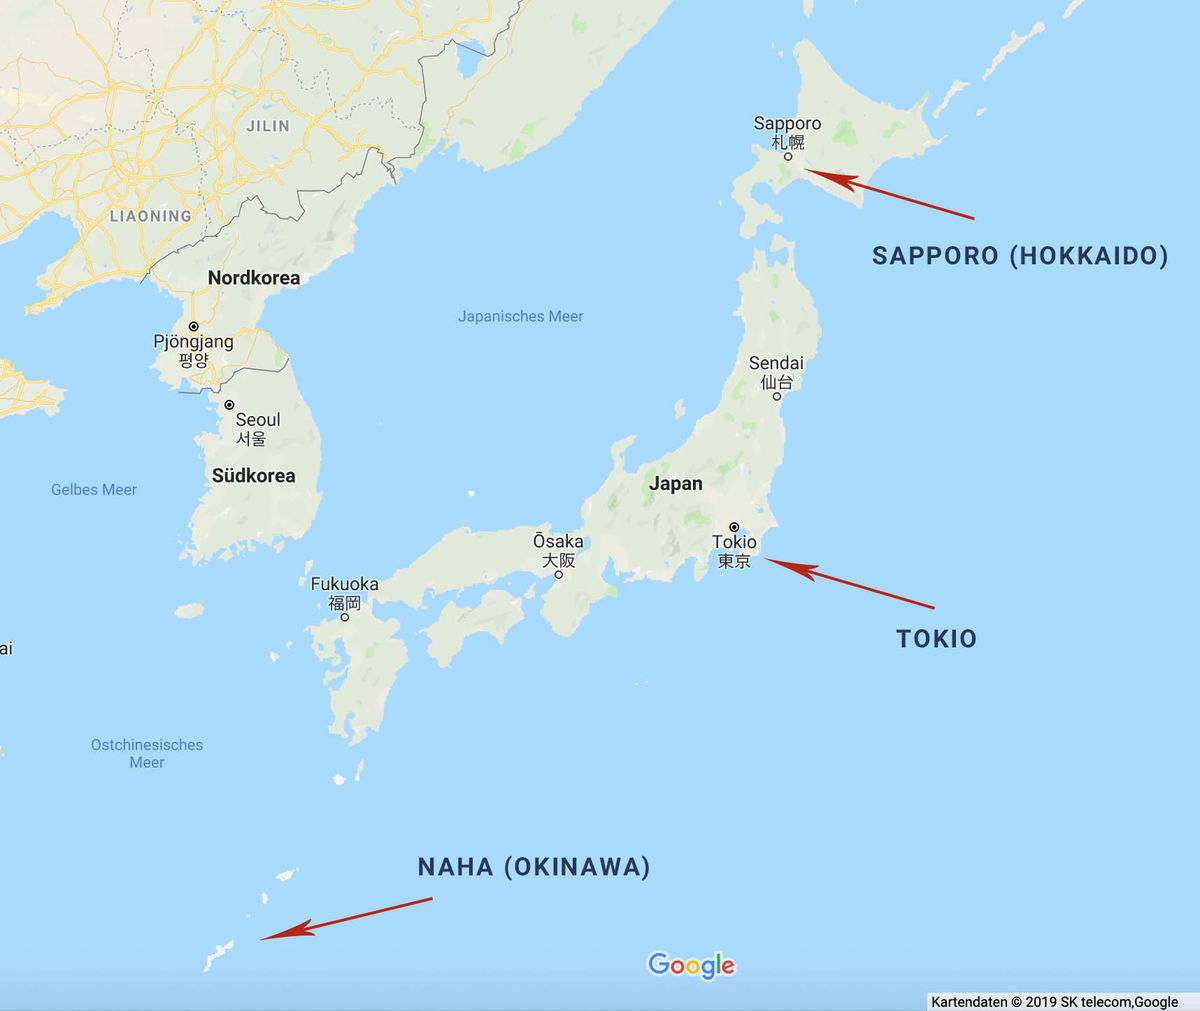
The image is a Google Maps screenshot of Japan and the Korean Peninsula, with three red arrows calling out cities spread across the country's full north-south span. The top arrow points to Sapporo (Hokkaido) on the northern island, the middle arrow marks Tokio on the main island of Honshu, and the third arrow points far to the southwest toward Naha (Okinawa), whose small islands sit near the bottom of the frame. The map's interface language is German, so the sea and country labels read "Japanisches Meer," "Nordkorea," "Südkorea," "Gelbes Meer," and "Ostchinesisches Meer." Other Japanese cities marked with dots include Sendai, Ōsaka, and Fukuoka, and Seoul and Pjöngjang appear on the Korean peninsula. The overall effect is a simple overview map showing how widely separated Japan's northern, central, and subtropical southern regions are.
The image is a Google Maps screenshot of Japan and the Korean Peninsula, with three red arrows calling out cities spread across the country's full north-south span. The top arrow points to Sapporo (Hokkaido) on the northern island, the middle arrow marks Tokio on the main island of Honshu, and the third arrow points far to the southwest toward Naha (Okinawa), whose small islands sit near the bottom of the frame.
The map's interface language is German, so the sea and country labels read "Japanisches Meer," "Nordkorea," "Südkorea," "Gelbes Meer," and "Ostchinesisches Meer." Other Japanese cities marked with dots include Sendai, Ōsaka, and Fukuoka, and Seoul and Pjöngjang appear on the Korean peninsula. The overall effect is a simple overview map showing how widely separated Japan's northern, central, and subtropical southern regions are.
圖片中的可見文字
JILIN
LIAONING
Nordkorea
Pjŏngjang
평양
Seoul
서울
Südkorea
Gelbes Meer
Japanisches Meer
Sapporo
札幌
SAPPORO (HOKKAIDO)
Sendai
仙台
Japan
Ōsaka
大阪
Tokio
東京
Fukuoka
福岡
TOKIO
Ostchinesisches
Meer
NAHA (OKINAWA)
Google
Kartendaten © 2019 SK telecom,Google
日本南部(沖繩、福岡;亞熱帶)

A sweeping view of a tropical beach in Okinawa, seen from an elevated spot. A long crescent of pale sand curves around a bay of clear turquoise water, with a handful of people scattered along the shore. Palm trees and dense green foliage fill the foreground, where rows of wooden lounge chairs and closed beach umbrellas sit on a terrace overlooking the sand. Across the water, small rocky islets covered in trees rise from the shallows, and hazy green mountains stretch along the horizon under a soft, overcast sky.
A sweeping view of a tropical beach in Okinawa, seen from an elevated spot. A long crescent of pale sand curves around a bay of clear turquoise water, with a handful of people scattered along the shore. Palm trees and dense green foliage fill the foreground, where rows of wooden lounge chairs and closed beach umbrellas sit on a terrace overlooking the sand. Across the water, small rocky islets covered in trees rise from the shallows, and hazy green mountains stretch along the horizon under a soft, overcast sky.
圖片中的可見文字
**Empty response**
尤其是沖繩,對於喜愛海灘和想避寒的人來說,簡直是天堂。即使是一月,平均氣溫仍然有17度。
當地居民與旅客幾乎全年都可以享受白色沙灘,僅11月至2月期間暫停開放。不過,務必要留意梅雨季和颱風季。梅雨季自五月開始,至六月中結束,颱風季則從七月持續到九月。
年初到日本南部旅行的人,甚至可以因為溫暖濕潤的氣候,從一月起就欣賞到早開的櫻花。
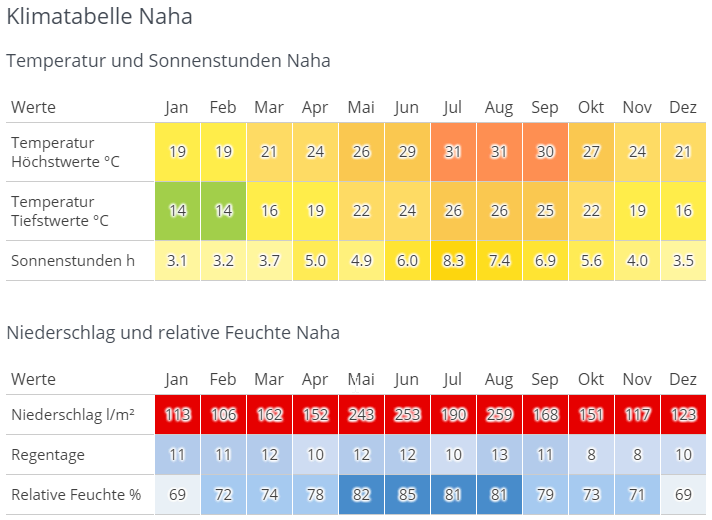
A German-language climate table for Naha on Okinawa, titled Klimatabelle Naha. The first section covers temperature and sunshine hours by month, January through December. Average highs climb from 19 °C in January and February to 31 °C in July and August, while lows range from 14 °C in winter to 26 °C at the height of summer. Sunshine peaks at 8.3 hours a day in July. The cells are color coded, shifting from green and yellow in the cooler months to orange in summer. The second section covers precipitation and relative humidity. Rainfall is substantial all year, from a low of 106 l/m² in February to a high of 259 l/m² in August, and every monthly value is marked in red. Rain days stay modest at 8 to 13 per month. Relative humidity runs from 69 percent in January and December up to 85 percent in June, shown in shades of blue.
A German-language climate table for Naha on Okinawa, titled Klimatabelle Naha. The first section covers temperature and sunshine hours by month, January through December. Average highs climb from 19 °C in January and February to 31 °C in July and August, while lows range from 14 °C in winter to 26 °C at the height of summer. Sunshine peaks at 8.3 hours a day in July. The cells are color coded, shifting from green and yellow in the cooler months to orange in summer.
The second section covers precipitation and relative humidity. Rainfall is substantial all year, from a low of 106 l/m² in February to a high of 259 l/m² in August, and every monthly value is marked in red. Rain days stay modest at 8 to 13 per month. Relative humidity runs from 69 percent in January and December up to 85 percent in June, shown in shades of blue.
圖片中的可見文字
# Klimatabelle Naha
## Temperatur und Sonnenstunden Naha
| Werte | Jan | Feb | Mar | Apr | Mai | Jun | Jul | Aug | Sep | Okt | Nov | Dez |
|---|---|---|---|---|---|---|---|---|---|---|---|---|
| Temperatur Höchstwerte °C | 19 | 19 | 21 | 24 | 26 | 29 | 31 | 31 | 30 | 27 | 24 | 21 |
| Temperatur Tiefstwerte °C | 14 | 14 | 16 | 19 | 22 | 24 | 26 | 26 | 25 | 22 | 19 | 16 |
| Sonnenstunden h | 3.1 | 3.2 | 3.7 | 5.0 | 4.9 | 6.0 | 8.3 | 7.4 | 6.9 | 5.6 | 4.0 | 3.5 |
## Niederschlag und relative Feuchte Naha
| Werte | Jan | Feb | Mar | Apr | Mai | Jun | Jul | Aug | Sep | Okt | Nov | Dez |
|---|---|---|---|---|---|---|---|---|---|---|---|---|
| Niederschlag l/m² | 113 | 106 | 162 | 152 | 243 | 253 | 190 | 259 | 168 | 151 | 117 | 123 |
| Regentage | 11 | 11 | 12 | 10 | 12 | 12 | 10 | 13 | 11 | 8 | 8 | 10 |
| Relative Feuchte % | 69 | 72 | 74 | 78 | 82 | 85 | 81 | 81 | 79 | 73 | 71 | 69 |
日本中部(東京、大阪、京都;溫帶)
日本中部的溫度一般比德國還高一些。春秋時分大約有15至20度,大多是晴朗天氣。特別是四月、五月以及十月、十一月,“天氣最理想”。
和南部一樣,中部也有梅雨季,六月和七月會遇到豪雨。隨後氣溫上升、濕度極高,延續到九月。特別是八月,氣溫常超過30度,受濕度影響更覺悶熱。
到了十二月開始天氣轉冷,山區甚至會出現-5到10度及降雪。
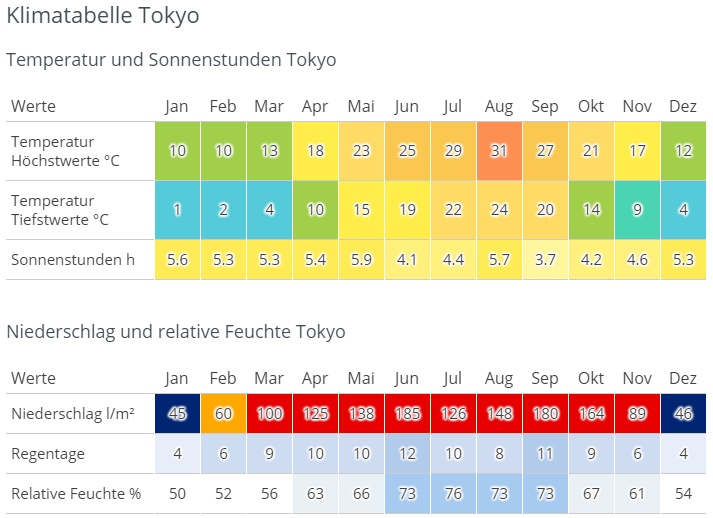
A German-language climate table for Tokyo, headed "Klimatabelle Tokyo," laid out as two color-coded tables with columns for each month from Jan to Dez. The first table, "Temperatur und Sonnenstunden Tokyo," has three rows. Average daily highs climb from 10 °C in January and February to a peak of 31 °C in August, then fall back to 12 °C in December. Lows run from 1 °C in January up to 24 °C in August. Sunshine hours stay between roughly 3.7 (September) and 5.9 per day (May). Each temperature cell is shaded on a scale from blue for the coldest months through green and yellow to red for the hottest. The second table, "Niederschlag und relative Feuchte Tokyo," covers rain. Monthly precipitation is lowest in January and December at 45 and 46 l/m² and highest in June at 185, with August (148) and September (180) also very wet. Rain days range from 4 per month in winter to 12 in June. Relative humidity sits near 50 to 56 percent in winter and reaches 76 percent in July. These cells use a blue-to-red shading, so the rainy summer months stand out in strong red while winter months are dark blue.
A German-language climate table for Tokyo, headed "Klimatabelle Tokyo," laid out as two color-coded tables with columns for each month from Jan to Dez.
The first table, "Temperatur und Sonnenstunden Tokyo," has three rows. Average daily highs climb from 10 °C in January and February to a peak of 31 °C in August, then fall back to 12 °C in December. Lows run from 1 °C in January up to 24 °C in August. Sunshine hours stay between roughly 3.7 (September) and 5.9 per day (May). Each temperature cell is shaded on a scale from blue for the coldest months through green and yellow to red for the hottest.
The second table, "Niederschlag und relative Feuchte Tokyo," covers rain. Monthly precipitation is lowest in January and December at 45 and 46 l/m² and highest in June at 185, with August (148) and September (180) also very wet. Rain days range from 4 per month in winter to 12 in June. Relative humidity sits near 50 to 56 percent in winter and reaches 76 percent in July. These cells use a blue-to-red shading, so the rainy summer months stand out in strong red while winter months are dark blue.
圖片中的可見文字
# Klimatabelle Tokyo
## Temperatur und Sonnenstunden Tokyo
| Werte | Jan | Feb | Mar | Apr | Mai | Jun | Jul | Aug | Sep | Okt | Nov | Dez |
|---|---|---|---|---|---|---|---|---|---|---|---|---|
| Temperatur Höchstwerte °C | 10 | 10 | 13 | 18 | 23 | 25 | 29 | 31 | 27 | 21 | 17 | 12 |
| Temperatur Tiefstwerte °C | 1 | 2 | 4 | 10 | 15 | 19 | 22 | 24 | 20 | 14 | 9 | 4 |
| Sonnenstunden h | 5.6 | 5.3 | 5.3 | 5.4 | 5.9 | 4.1 | 4.4 | 5.7 | 3.7 | 4.2 | 4.6 | 5.3 |
## Niederschlag und relative Feuchte Tokyo
| Werte | Jan | Feb | Mar | Apr | Mai | Jun | Jul | Aug | Sep | Okt | Nov | Dez |
|---|---|---|---|---|---|---|---|---|---|---|---|---|
| Niederschlag l/m² | 45 | 60 | 100 | 125 | 138 | 185 | 126 | 148 | 180 | 164 | 89 | 46 |
| Regentage | 4 | 6 | 9 | 10 | 10 | 12 | 10 | 8 | 11 | 9 | 6 | 4 |
| Relative Feuchte % | 50 | 52 | 56 | 63 | 66 | 73 | 76 | 73 | 73 | 67 | 61 | 54 |
日本北部(青森、北海道;涼溫帶)
北日本是滑雪與登山愛好者的夢想地。十二月至三月整個區域都會下雪,積雪甚至能達數公尺,氣溫幾乎不超過0度。到夏季(六月至八月),則能在25度左右的宜人氣溫中親近自然。
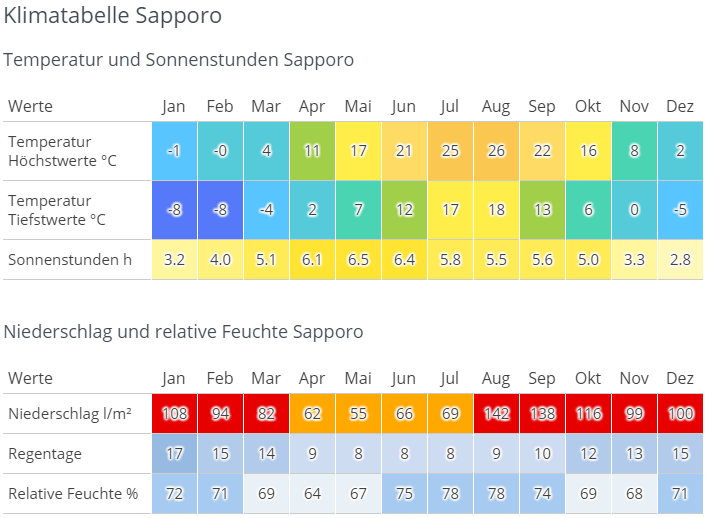
A German-language climate chart for Sapporo on Japan's northern island of Hokkaido, built as two color-coded tables spanning all twelve months. The first table covers temperature and sunshine, with cells shaded from blue in the cold months to yellow and orange in the warm ones. Daily highs sit at -1 and 0 °C in January and February, climb through a mild spring to 21 °C in June, peak at 26 °C in August, and fall back to 2 °C by December. Lows range from -8 °C in midwinter to 18 °C in summer. Sunshine stays modest year round, from 2.8 hours in December up to 6.5 in May. The second table covers moisture. Precipitation bottoms out at 55 liters per square meter in May and peaks at 142 in August and 138 in September, with the wettest cells highlighted in red. Rain days run from 8 in summer to 17 in January, and relative humidity stays between 64 and 78 percent, highest in July and August.
A German-language climate chart for Sapporo on Japan's northern island of Hokkaido, built as two color-coded tables spanning all twelve months. The first table covers temperature and sunshine, with cells shaded from blue in the cold months to yellow and orange in the warm ones. Daily highs sit at -1 and 0 °C in January and February, climb through a mild spring to 21 °C in June, peak at 26 °C in August, and fall back to 2 °C by December. Lows range from -8 °C in midwinter to 18 °C in summer. Sunshine stays modest year round, from 2.8 hours in December up to 6.5 in May.
The second table covers moisture. Precipitation bottoms out at 55 liters per square meter in May and peaks at 142 in August and 138 in September, with the wettest cells highlighted in red. Rain days run from 8 in summer to 17 in January, and relative humidity stays between 64 and 78 percent, highest in July and August.
圖片中的可見文字
# Klimatabelle Sapporo
## Temperatur und Sonnenstunden Sapporo
| Werte | Jan | Feb | Mar | Apr | Mai | Jun | Jul | Aug | Sep | Okt | Nov | Dez |
|---|---|---|---|---|---|---|---|---|---|---|---|---|
| Temperatur Höchstwerte °C | -1 | -0 | 4 | 11 | 17 | 21 | 25 | 26 | 22 | 16 | 8 | 2 |
| Temperatur Tiefstwerte °C | -8 | -8 | -4 | 2 | 7 | 12 | 17 | 18 | 13 | 6 | 0 | -5 |
| Sonnenstunden h | 3.2 | 4.0 | 5.1 | 6.1 | 6.5 | 6.4 | 5.8 | 5.5 | 5.6 | 5.0 | 3.3 | 2.8 |
## Niederschlag und relative Feuchte Sapporo
| Werte | Jan | Feb | Mar | Apr | Mai | Jun | Jul | Aug | Sep | Okt | Nov | Dez |
|---|---|---|---|---|---|---|---|---|---|---|---|---|
| Niederschlag l/m² | 108 | 94 | 82 | 62 | 55 | 66 | 69 | 142 | 138 | 116 | 99 | 100 |
| Regentage | 17 | 15 | 14 | 9 | 8 | 8 | 8 | 9 | 10 | 12 | 13 | 15 |
| Relative Feuchte % | 72 | 71 | 69 | 64 | 67 | 75 | 78 | 78 | 74 | 69 | 68 | 71 |
德國氣候 vs. 日本氣候
兩國的共通點在於,都有分明的四季。北日本的氣候最接近德國,中部均溫略高,南部則明顯高於德國。高濕度與日本獨有的梅雨,則是德國所沒有的。
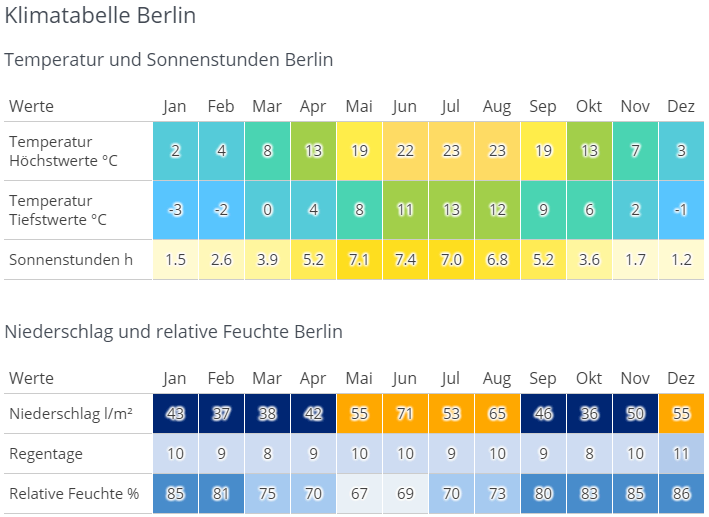
A German-language climate chart for Berlin ("Klimatabelle Berlin") presented as two color-coded tables covering all twelve months. The first table, "Temperatur und Sonnenstunden Berlin," shows three rows: average highs ranging from 2°C in January to 23°C in July and August, average lows from -3°C in January to 13°C in July, and sunshine hours peaking at 7.4 in June. Cells are shaded on a blue-to-yellow gradient so warm months stand out in yellow and cold months in blue-green. The second table, "Niederschlag und relative Feuchte Berlin," covers precipitation in liters per square meter (highest at 71 in June), rainy days per month (mostly 8 to 11), and relative humidity, which is highest in the winter months at 85–86% and lowest in May at 67%. Precipitation cells use a dark-blue-to-orange scale, with the wettest months highlighted in orange.
A German-language climate chart for Berlin ("Klimatabelle Berlin") presented as two color-coded tables covering all twelve months.
The first table, "Temperatur und Sonnenstunden Berlin," shows three rows: average highs ranging from 2°C in January to 23°C in July and August, average lows from -3°C in January to 13°C in July, and sunshine hours peaking at 7.4 in June. Cells are shaded on a blue-to-yellow gradient so warm months stand out in yellow and cold months in blue-green.
The second table, "Niederschlag und relative Feuchte Berlin," covers precipitation in liters per square meter (highest at 71 in June), rainy days per month (mostly 8 to 11), and relative humidity, which is highest in the winter months at 85–86% and lowest in May at 67%. Precipitation cells use a dark-blue-to-orange scale, with the wettest months highlighted in orange.
圖片中的可見文字
# Klimatabelle Berlin
Temperatur und Sonnenstunden Berlin
| Werte | Jan | Feb | Mar | Apr | Mai | Jun | Jul | Aug | Sep | Okt | Nov | Dez |
| --- | --- | --- | --- | --- | --- | --- | --- | --- | --- | --- | --- | --- |
| Temperatur Höchstwerte °C | 2 | 4 | 8 | 13 | 19 | 22 | 23 | 23 | 19 | 13 | 7 | 3 |
| Temperatur Tiefstwerte °C | -3 | -2 | 0 | 4 | 8 | 11 | 13 | 12 | 9 | 6 | 2 | -1 |
| Sonnenstunden h | 1.5 | 2.6 | 3.9 | 5.2 | 7.1 | 7.4 | 7.0 | 6.8 | 5.2 | 3.6 | 1.7 | 1.2 |
Niederschlag und relative Feuchte Berlin
| Werte | Jan | Feb | Mar | Apr | Mai | Jun | Jul | Aug | Sep | Okt | Nov | Dez |
| --- | --- | --- | --- | --- | --- | --- | --- | --- | --- | --- | --- | --- |
| Niederschlag l/m² | 48 | 37 | 38 | 42 | 55 | 71 | 53 | 65 | 46 | 36 | 50 | 55 |
| Regentage | 10 | 9 | 8 | 9 | 10 | 10 | 9 | 10 | 9 | 8 | 10 | 11 |
| Relative Feuchte % | 85 | 81 | 75 | 70 | 67 | 69 | 70 | 73 | 80 | 83 | 85 | 86 |
日本天氣的形成原因
由於日本橫跨多個緯度,氣候受各種風和氣流影響。北部冬季有來自西伯利亞的寒流帶來積雪與低溫;夏季則有來自南方的熱帶氣流,帶來季風雨和炎熱天氣。此外,南部的暖流與東北部的寒流海水,也進一步加劇氣候區別。
另外,日本幾乎不會有旱災,全年均可能下雨,其中以中部降雨最多,北部最少。
你想在日本體驗什麼?
冬季運動
北海道與本州北部為你準備了大量雪地與舉世聞名的滑雪道,無論是新手還是高手都能找到樂趣!
海灘假期
從三月起日本南部的海灘就可享受,尤其是沖繩,絕不輸夏威夷等知名度假地。若你想游泳,建議避開盛夏,因時常會下雨,潛水、浮潛則不受影響。
東京都會
春秋最適合造訪東京,因為夏天都市氣溫非常高,冬天則可能十分寒冷。
親近自然
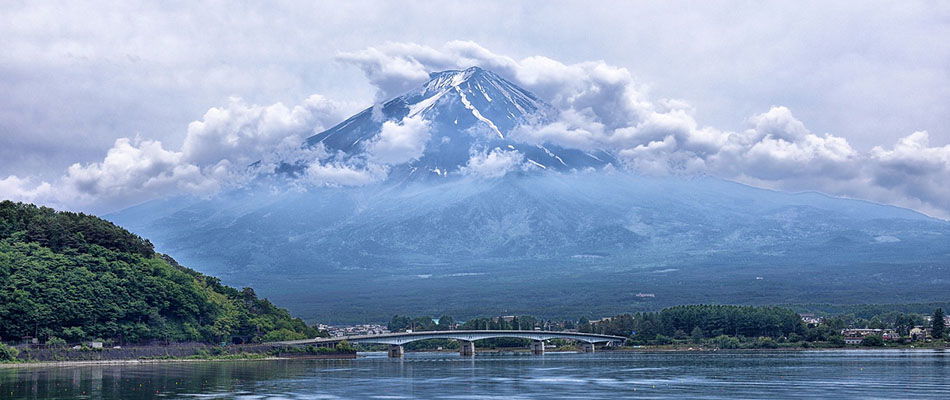
Mount Fuji fills the frame, its snow-streaked summit half swallowed by thick white clouds that drift across the peak and trail down the slopes. The mountain's blue-grey lower flanks stretch down toward a calm lake in the foreground, where a long, low road bridge crosses the water. A densely forested green hill rises on the left bank, and low buildings and trees line the far shore beneath the mountain. It is a classic view of Japan's tallest peak from one of the lakes at its foot, with the spring or early summer snowline still visible above the clouds.
Mount Fuji fills the frame, its snow-streaked summit half swallowed by thick white clouds that drift across the peak and trail down the slopes. The mountain's blue-grey lower flanks stretch down toward a calm lake in the foreground, where a long, low road bridge crosses the water. A densely forested green hill rises on the left bank, and low buildings and trees line the far shore beneath the mountain. It is a classic view of Japan's tallest peak from one of the lakes at its foot, with the spring or early summer snowline still visible above the clouds.
圖片中的可見文字
No clearly readable text.
想健行的人,推薦夏季前往北海道,不僅能欣賞絕美景致,也有宜人氣溫。
不喜歡炎熱氣候的建議
如果你討厭30度以上的高溫與高濕,最好整個夏季都不要前往中部及南部日本旅遊。
日本的四季
春天
沒有什麼比櫻花更代表日本春天,每年無數旅客特地來感受溫和氣溫下白粉色花海。春天尤其適合度蜜月!

夏天
除了沙灘與山巒,日本夏天還有各式各樣的慶典與煙火大會,可以消暑。

秋天
秋天你能享受舒適溫度與楓紅,讓大地染上紅、金與橙的絢爛。
冬天
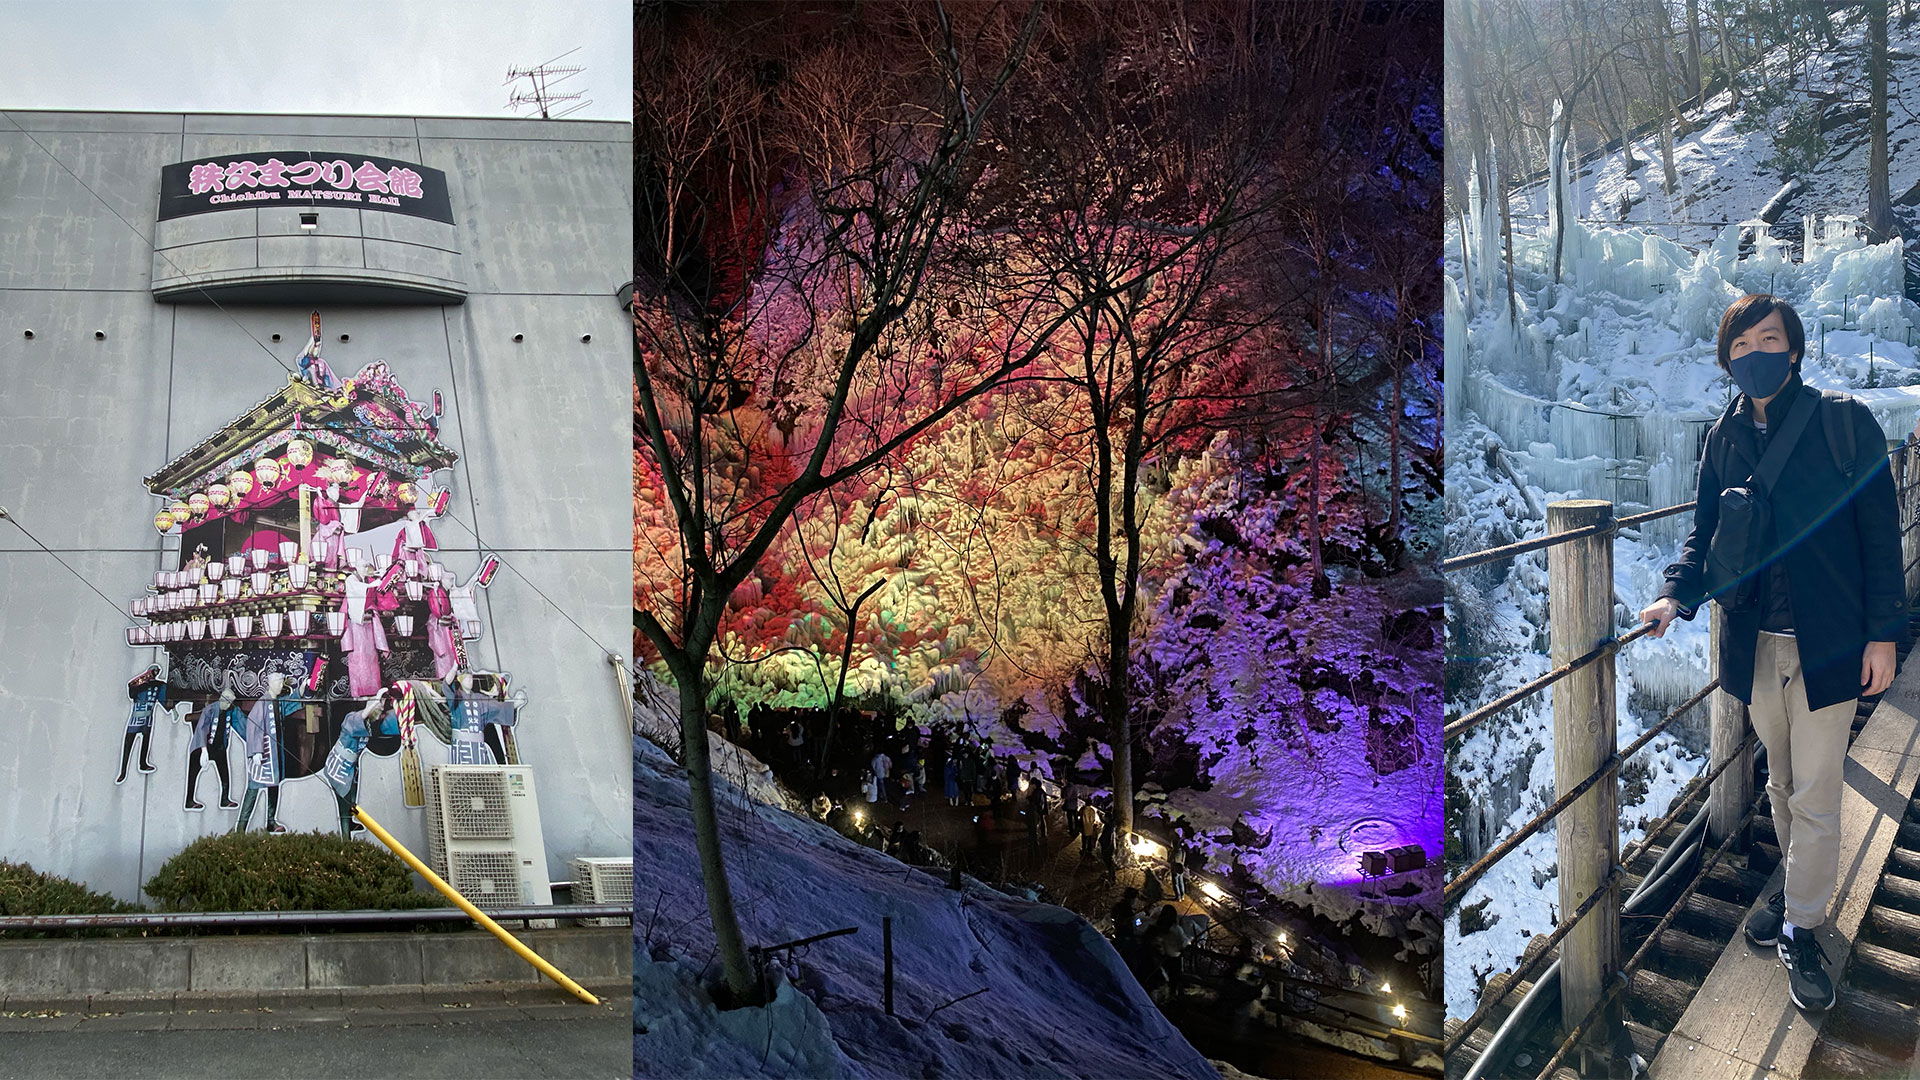
對滑雪和滑雪板愛好者來說是最棒的季節。喜歡放鬆的人則可泡Onsen或者漫步雪景。冬天也是品嚐鮮美海產的絕佳時機。
我最喜歡的日本季節
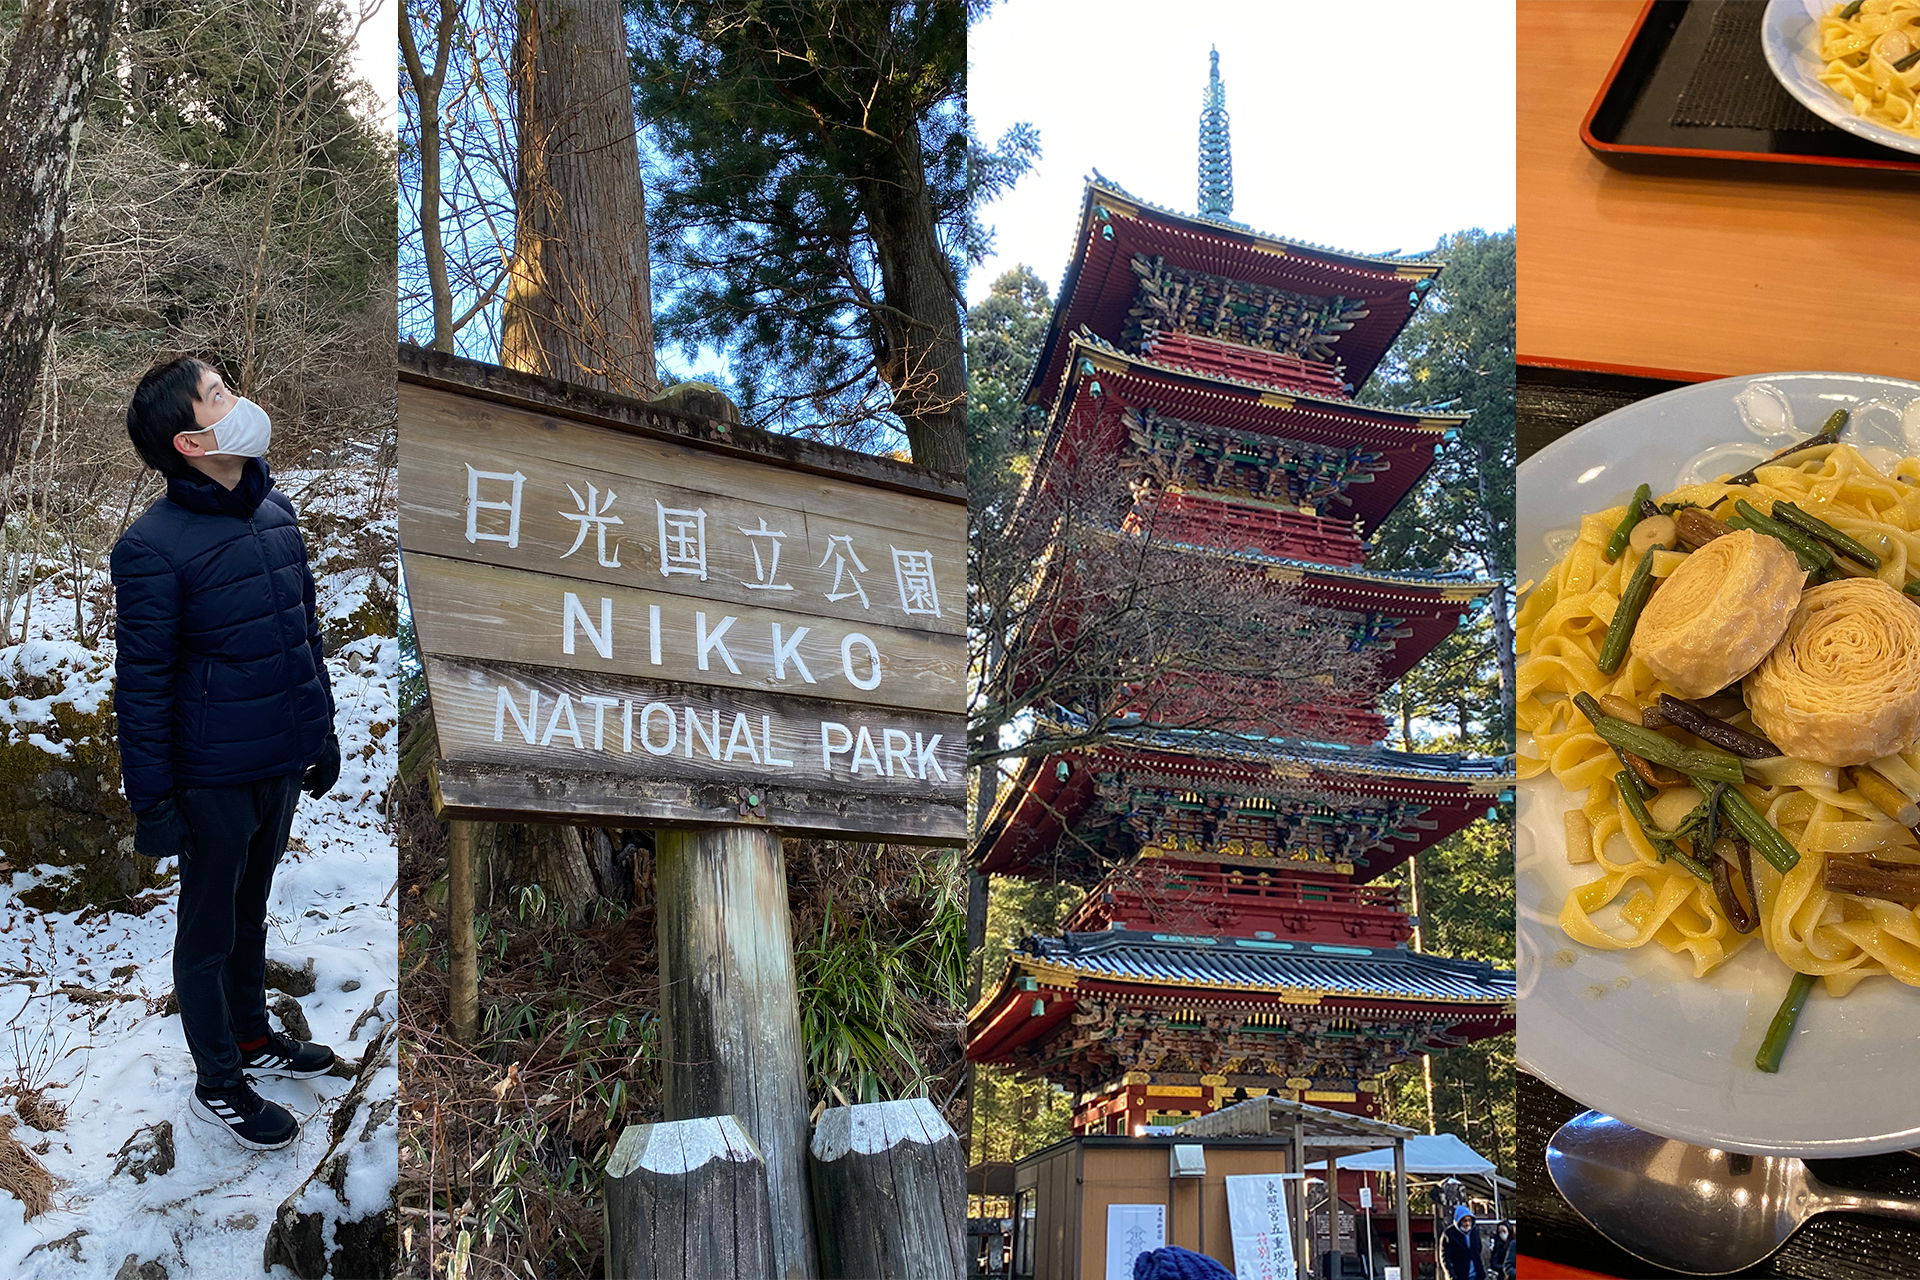
對我來說,春天和秋天是首選,因為不冷也不熱且大多晴朗,是最佳組合!日本夏天常讓我聯想到溫室或動物園的熱帶館,又悶又熱又濕,實在難以忍受。
此外,與德國相比,我覺得日本四季過渡比較溫和,不會非常突然變天。
日本的假期與旅遊旺季
如果可以,盡量避開旅遊旺季和主要假期!這段期間,不僅價錢飆漲,人潮也會考驗你的耐心。
櫻花季
一年之初的重頭戲就是櫻花季。三月底到四月初,遊客與日本人都爭相追逐最佳賞櫻點。
黃金週
每年四月底到五月初,有四個法定假日連成一週,許多公司還會給出橋接假。這時全日本的熱門景點幾乎都被國內旅客擠爆。
盂蘭盆節(Obon)
這個八月中旬的假日,不少日本人會回老家與家人團聚,或者外出旅遊。北海道和沖繩此時特別受歡迎。
楓葉季
跟櫻花一樣熱門的是秋天的楓葉季。京都、廣島和東京等景點在十一月底會被遊客塞滿。建議在平日參觀,週末盡量避免。
年末年初
跟Obon一樣,跨年假期許多日本人會返鄉與家人團圓,像德國人聖誕節一樣,因此旅遊業這段期間也很旺盛。
小撇步:新年過後有許多商店大拍賣,可以撿到便宜。
颱風季
每年六月到九月為颱風季,帶來高溫及大量降雨。多數颱風不會直接襲擊本州,特別是東京比較少受影響,南部則常常首當其衝。雖然強烈颱風很少見,但還是建議事前做好應變準備。颱風季期間,請每日關注新聞和天氣預報,以免措手不及。
總結
何時造訪日本很難有標準答案,日本四季皆美。每個地區與季節都有自己獨特的亮點,總有適合你的選擇。建議你根據興趣選擇旅行時間。
評論
初次發文,先來了解一下情況。我們曾經在五月造訪過日本,去了東京、京都和廣島一帶。那次旅行非常棒。現在我們打算下次去日本南部走走。祝好,Doreen
哈囉Doreen,很高興聽到你也喜歡。日本南部同樣非常美麗,希望你們在那裡也玩得很開心! 祝好,Ryusei