
Table of contents:
TL;DR
Japan's diverse climate, categorized into six zones ranging from subtropical to cool temperate, influences the best times to visit. The site discusses travel options across three main regions: the subtropical south (Okinawa and Fukuoka), which offers warm temperatures and beautiful beaches year-round, although weather can be affected by the rainy and typhoon seasons; central Japan (Tokyo, Osaka, Kyoto), known for its mild spring and autumn weather, ideal for sightseeing, but with high humidity and heat in summer; and northern Japan (Aomori, Hokkaido), a winter wonderland perfect for sports enthusiasts, where December to March sees heavy snowfall and cold temperatures. Comparisons to Germany's climate highlight that while Japan also has four distinct seasons, its unique weather patterns, including higher humidity and significant rainfall, set it apart. Whether travelers seek vibrant cherry blossoms, sunshine on sandy beaches, or winter sports, understanding these regional climates ensures an enjoyable visit to Japan at any time of year.As Japan can be divided into six climate zones due to its length, from subtropical to cool temperate, there is no single answer to when is the best time to travel to Japan. Rainy season, high humidity and typhoons are just as much part of the climate as Siberian winds. So it all depends on what temperatures you prefer for your holiday and what you want to see in Japan.
To keep it clear, we'll simply combine the six zones into three:
- Hokkaido and the northern part of the main island of Honshu
- Central Japan around Tokyo, Osaka and Kyoto
- the southern part of Honshu, together with Okinawa
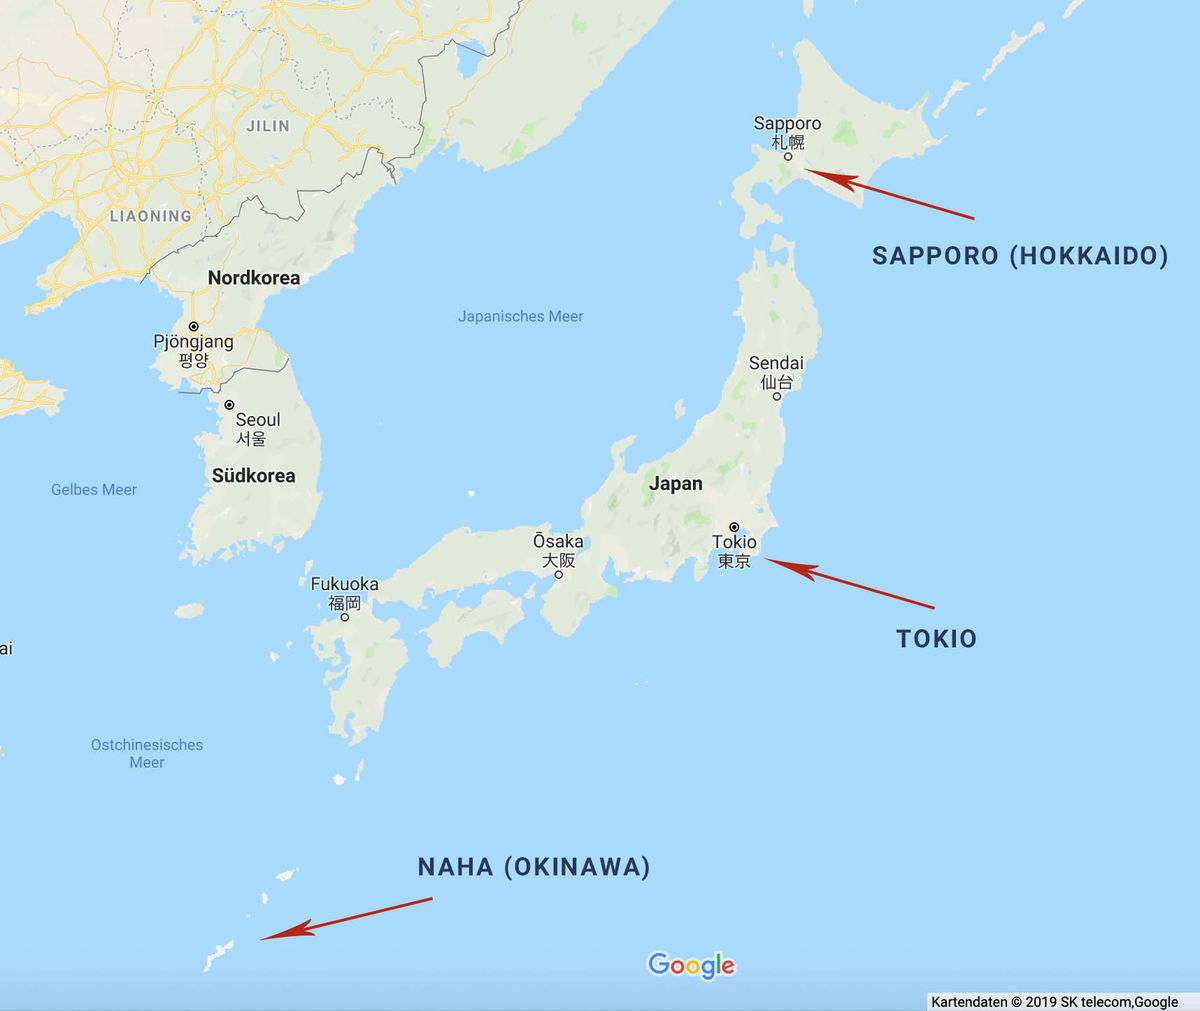
The image is a Google Maps screenshot of Japan and the Korean Peninsula, with three red arrows calling out cities spread across the country's full north-south span. The top arrow points to Sapporo (Hokkaido) on the northern island, the middle arrow marks Tokio on the main island of Honshu, and the third arrow points far to the southwest toward Naha (Okinawa), whose small islands sit near the bottom of the frame. The map's interface language is German, so the sea and country labels read "Japanisches Meer," "Nordkorea," "Südkorea," "Gelbes Meer," and "Ostchinesisches Meer." Other Japanese cities marked with dots include Sendai, Ōsaka, and Fukuoka, and Seoul and Pjöngjang appear on the Korean peninsula. The overall effect is a simple overview map showing how widely separated Japan's northern, central, and subtropical southern regions are.
The image is a Google Maps screenshot of Japan and the Korean Peninsula, with three red arrows calling out cities spread across the country's full north-south span. The top arrow points to Sapporo (Hokkaido) on the northern island, the middle arrow marks Tokio on the main island of Honshu, and the third arrow points far to the southwest toward Naha (Okinawa), whose small islands sit near the bottom of the frame.
The map's interface language is German, so the sea and country labels read "Japanisches Meer," "Nordkorea," "Südkorea," "Gelbes Meer," and "Ostchinesisches Meer." Other Japanese cities marked with dots include Sendai, Ōsaka, and Fukuoka, and Seoul and Pjöngjang appear on the Korean peninsula. The overall effect is a simple overview map showing how widely separated Japan's northern, central, and subtropical southern regions are.
Visible text in the image
JILIN
LIAONING
Nordkorea
Pjŏngjang
평양
Seoul
서울
Südkorea
Gelbes Meer
Japanisches Meer
Sapporo
札幌
SAPPORO (HOKKAIDO)
Sendai
仙台
Japan
Ōsaka
大阪
Tokio
東京
Fukuoka
福岡
TOKIO
Ostchinesisches
Meer
NAHA (OKINAWA)
Google
Kartendaten © 2019 SK telecom,Google
Southern Japan (Okinawa, Fukuoka; subtropical)

A sweeping view of a tropical beach in Okinawa, seen from an elevated spot. A long crescent of pale sand curves around a bay of clear turquoise water, with a handful of people scattered along the shore. Palm trees and dense green foliage fill the foreground, where rows of wooden lounge chairs and closed beach umbrellas sit on a terrace overlooking the sand. Across the water, small rocky islets covered in trees rise from the shallows, and hazy green mountains stretch along the horizon under a soft, overcast sky.
A sweeping view of a tropical beach in Okinawa, seen from an elevated spot. A long crescent of pale sand curves around a bay of clear turquoise water, with a handful of people scattered along the shore. Palm trees and dense green foliage fill the foreground, where rows of wooden lounge chairs and closed beach umbrellas sit on a terrace overlooking the sand. Across the water, small rocky islets covered in trees rise from the shallows, and hazy green mountains stretch along the horizon under a soft, overcast sky.
Visible text in the image
**Empty response**
Okinawa in particular is a true paradise for beach lovers and anyone who wants to escape the cold. Even in January, average temperatures are still around 17 degrees.
Residents and tourists have white sandy beaches at their disposal almost all year round, only closed from November to February. However, you should definitely keep an eye on the rainy season and typhoon season. The former starts in May and ends in mid-June, while the latter lasts from July to September.
If you travel to southern Japan at the beginning of the year, you can enjoy the first cherry blossoms, which can be seen from January onwards, depending on the region, due to the warm and humid climate.
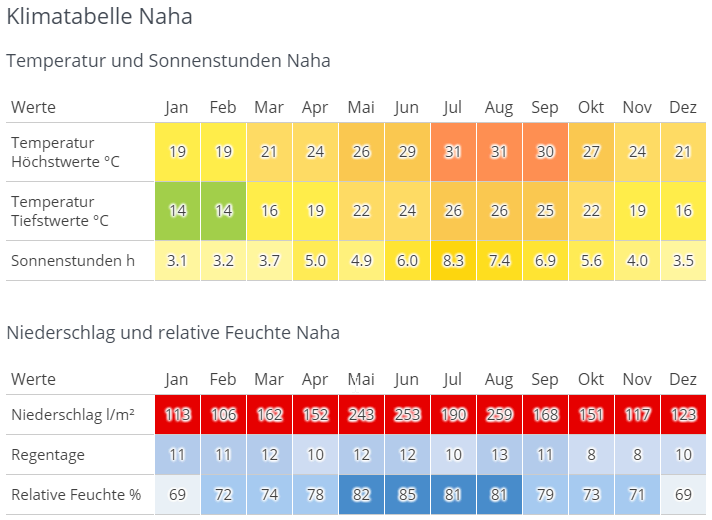
A German-language climate table for Naha on Okinawa, titled Klimatabelle Naha. The first section covers temperature and sunshine hours by month, January through December. Average highs climb from 19 °C in January and February to 31 °C in July and August, while lows range from 14 °C in winter to 26 °C at the height of summer. Sunshine peaks at 8.3 hours a day in July. The cells are color coded, shifting from green and yellow in the cooler months to orange in summer. The second section covers precipitation and relative humidity. Rainfall is substantial all year, from a low of 106 l/m² in February to a high of 259 l/m² in August, and every monthly value is marked in red. Rain days stay modest at 8 to 13 per month. Relative humidity runs from 69 percent in January and December up to 85 percent in June, shown in shades of blue.
A German-language climate table for Naha on Okinawa, titled Klimatabelle Naha. The first section covers temperature and sunshine hours by month, January through December. Average highs climb from 19 °C in January and February to 31 °C in July and August, while lows range from 14 °C in winter to 26 °C at the height of summer. Sunshine peaks at 8.3 hours a day in July. The cells are color coded, shifting from green and yellow in the cooler months to orange in summer.
The second section covers precipitation and relative humidity. Rainfall is substantial all year, from a low of 106 l/m² in February to a high of 259 l/m² in August, and every monthly value is marked in red. Rain days stay modest at 8 to 13 per month. Relative humidity runs from 69 percent in January and December up to 85 percent in June, shown in shades of blue.
Visible text in the image
# Klimatabelle Naha
## Temperatur und Sonnenstunden Naha
| Werte | Jan | Feb | Mar | Apr | Mai | Jun | Jul | Aug | Sep | Okt | Nov | Dez |
|---|---|---|---|---|---|---|---|---|---|---|---|---|
| Temperatur Höchstwerte °C | 19 | 19 | 21 | 24 | 26 | 29 | 31 | 31 | 30 | 27 | 24 | 21 |
| Temperatur Tiefstwerte °C | 14 | 14 | 16 | 19 | 22 | 24 | 26 | 26 | 25 | 22 | 19 | 16 |
| Sonnenstunden h | 3.1 | 3.2 | 3.7 | 5.0 | 4.9 | 6.0 | 8.3 | 7.4 | 6.9 | 5.6 | 4.0 | 3.5 |
## Niederschlag und relative Feuchte Naha
| Werte | Jan | Feb | Mar | Apr | Mai | Jun | Jul | Aug | Sep | Okt | Nov | Dez |
|---|---|---|---|---|---|---|---|---|---|---|---|---|
| Niederschlag l/m² | 113 | 106 | 162 | 152 | 243 | 253 | 190 | 259 | 168 | 151 | 117 | 123 |
| Regentage | 11 | 11 | 12 | 10 | 12 | 12 | 10 | 13 | 11 | 8 | 8 | 10 |
| Relative Feuchte % | 69 | 72 | 74 | 78 | 82 | 85 | 81 | 81 | 79 | 73 | 71 | 69 |
Central Japan (Tokyo, Osaka, Kyoto; temperate)
Temperatures in Central Japan are typically slightly higher than in Germany. So in spring and autumn, mild temperatures of 15 to 20 degrees prevail, usually including sunshine. The weather is ideal, especially in April/May and October/November.
As in the south, there is a rainy season, which in Central Japan brings torrential downpours, especially in June and July. The resulting rising temperatures and extremely high humidity then extend into September. Temperatures of at least 30 degrees are normal, especially in August, which feel significantly more oppressive due to the high humidity.
From December onwards, it gets fresh, with -5 to 10 degrees and snow in the mountainous regions.
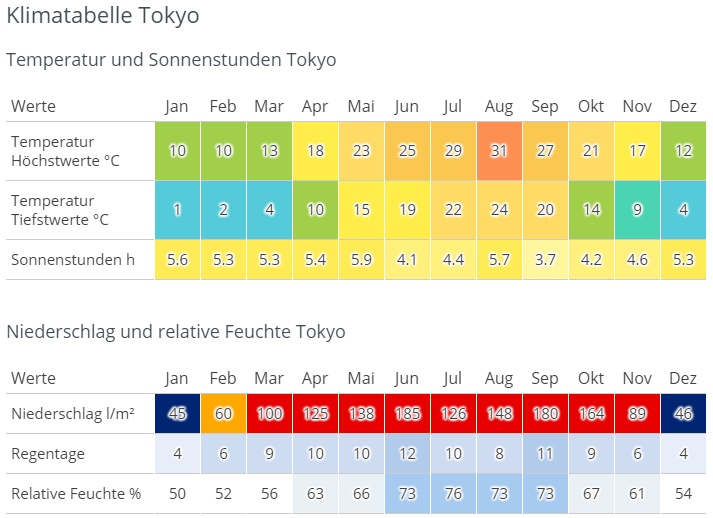
A German-language climate table for Tokyo, headed "Klimatabelle Tokyo," laid out as two color-coded tables with columns for each month from Jan to Dez. The first table, "Temperatur und Sonnenstunden Tokyo," has three rows. Average daily highs climb from 10 °C in January and February to a peak of 31 °C in August, then fall back to 12 °C in December. Lows run from 1 °C in January up to 24 °C in August. Sunshine hours stay between roughly 3.7 (September) and 5.9 per day (May). Each temperature cell is shaded on a scale from blue for the coldest months through green and yellow to red for the hottest. The second table, "Niederschlag und relative Feuchte Tokyo," covers rain. Monthly precipitation is lowest in January and December at 45 and 46 l/m² and highest in June at 185, with August (148) and September (180) also very wet. Rain days range from 4 per month in winter to 12 in June. Relative humidity sits near 50 to 56 percent in winter and reaches 76 percent in July. These cells use a blue-to-red shading, so the rainy summer months stand out in strong red while winter months are dark blue.
A German-language climate table for Tokyo, headed "Klimatabelle Tokyo," laid out as two color-coded tables with columns for each month from Jan to Dez.
The first table, "Temperatur und Sonnenstunden Tokyo," has three rows. Average daily highs climb from 10 °C in January and February to a peak of 31 °C in August, then fall back to 12 °C in December. Lows run from 1 °C in January up to 24 °C in August. Sunshine hours stay between roughly 3.7 (September) and 5.9 per day (May). Each temperature cell is shaded on a scale from blue for the coldest months through green and yellow to red for the hottest.
The second table, "Niederschlag und relative Feuchte Tokyo," covers rain. Monthly precipitation is lowest in January and December at 45 and 46 l/m² and highest in June at 185, with August (148) and September (180) also very wet. Rain days range from 4 per month in winter to 12 in June. Relative humidity sits near 50 to 56 percent in winter and reaches 76 percent in July. These cells use a blue-to-red shading, so the rainy summer months stand out in strong red while winter months are dark blue.
Visible text in the image
# Klimatabelle Tokyo
## Temperatur und Sonnenstunden Tokyo
| Werte | Jan | Feb | Mar | Apr | Mai | Jun | Jul | Aug | Sep | Okt | Nov | Dez |
|---|---|---|---|---|---|---|---|---|---|---|---|---|
| Temperatur Höchstwerte °C | 10 | 10 | 13 | 18 | 23 | 25 | 29 | 31 | 27 | 21 | 17 | 12 |
| Temperatur Tiefstwerte °C | 1 | 2 | 4 | 10 | 15 | 19 | 22 | 24 | 20 | 14 | 9 | 4 |
| Sonnenstunden h | 5.6 | 5.3 | 5.3 | 5.4 | 5.9 | 4.1 | 4.4 | 5.7 | 3.7 | 4.2 | 4.6 | 5.3 |
## Niederschlag und relative Feuchte Tokyo
| Werte | Jan | Feb | Mar | Apr | Mai | Jun | Jul | Aug | Sep | Okt | Nov | Dez |
|---|---|---|---|---|---|---|---|---|---|---|---|---|
| Niederschlag l/m² | 45 | 60 | 100 | 125 | 138 | 185 | 126 | 148 | 180 | 164 | 89 | 46 |
| Regentage | 4 | 6 | 9 | 10 | 10 | 12 | 10 | 8 | 11 | 9 | 6 | 4 |
| Relative Feuchte % | 50 | 52 | 56 | 63 | 66 | 73 | 76 | 73 | 73 | 67 | 61 | 54 |
Northern Japan (Aomori, Hokkaido; cool temperate)
Northern Japan is a dream for all winter sports enthusiasts and hikers. From December to March, snow falls throughout the region, sometimes meters deep, and temperatures rarely climb above 0 degrees. In summer, from June to August, you can enjoy nature at pleasant temperatures of just under 25 degrees.
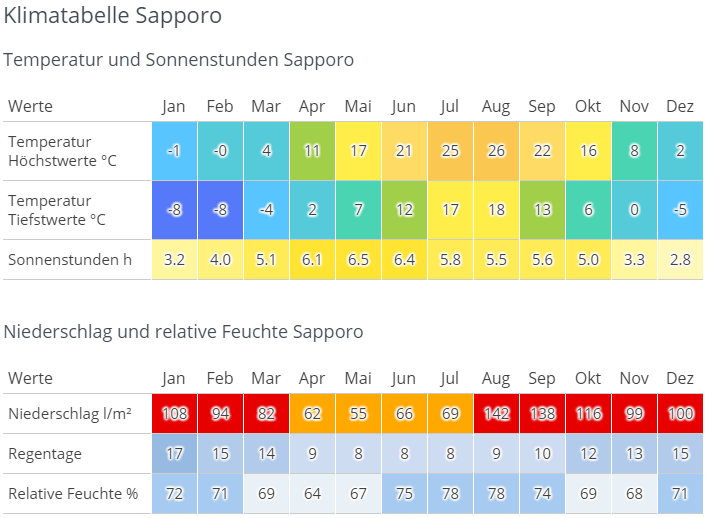
A German-language climate chart for Sapporo on Japan's northern island of Hokkaido, built as two color-coded tables spanning all twelve months. The first table covers temperature and sunshine, with cells shaded from blue in the cold months to yellow and orange in the warm ones. Daily highs sit at -1 and 0 °C in January and February, climb through a mild spring to 21 °C in June, peak at 26 °C in August, and fall back to 2 °C by December. Lows range from -8 °C in midwinter to 18 °C in summer. Sunshine stays modest year round, from 2.8 hours in December up to 6.5 in May. The second table covers moisture. Precipitation bottoms out at 55 liters per square meter in May and peaks at 142 in August and 138 in September, with the wettest cells highlighted in red. Rain days run from 8 in summer to 17 in January, and relative humidity stays between 64 and 78 percent, highest in July and August.
A German-language climate chart for Sapporo on Japan's northern island of Hokkaido, built as two color-coded tables spanning all twelve months. The first table covers temperature and sunshine, with cells shaded from blue in the cold months to yellow and orange in the warm ones. Daily highs sit at -1 and 0 °C in January and February, climb through a mild spring to 21 °C in June, peak at 26 °C in August, and fall back to 2 °C by December. Lows range from -8 °C in midwinter to 18 °C in summer. Sunshine stays modest year round, from 2.8 hours in December up to 6.5 in May.
The second table covers moisture. Precipitation bottoms out at 55 liters per square meter in May and peaks at 142 in August and 138 in September, with the wettest cells highlighted in red. Rain days run from 8 in summer to 17 in January, and relative humidity stays between 64 and 78 percent, highest in July and August.
Visible text in the image
# Klimatabelle Sapporo
## Temperatur und Sonnenstunden Sapporo
| Werte | Jan | Feb | Mar | Apr | Mai | Jun | Jul | Aug | Sep | Okt | Nov | Dez |
|---|---|---|---|---|---|---|---|---|---|---|---|---|
| Temperatur Höchstwerte °C | -1 | -0 | 4 | 11 | 17 | 21 | 25 | 26 | 22 | 16 | 8 | 2 |
| Temperatur Tiefstwerte °C | -8 | -8 | -4 | 2 | 7 | 12 | 17 | 18 | 13 | 6 | 0 | -5 |
| Sonnenstunden h | 3.2 | 4.0 | 5.1 | 6.1 | 6.5 | 6.4 | 5.8 | 5.5 | 5.6 | 5.0 | 3.3 | 2.8 |
## Niederschlag und relative Feuchte Sapporo
| Werte | Jan | Feb | Mar | Apr | Mai | Jun | Jul | Aug | Sep | Okt | Nov | Dez |
|---|---|---|---|---|---|---|---|---|---|---|---|---|
| Niederschlag l/m² | 108 | 94 | 82 | 62 | 55 | 66 | 69 | 142 | 138 | 116 | 99 | 100 |
| Regentage | 17 | 15 | 14 | 9 | 8 | 8 | 8 | 9 | 10 | 12 | 13 | 15 |
| Relative Feuchte % | 72 | 71 | 69 | 64 | 67 | 75 | 78 | 78 | 74 | 69 | 68 | 71 |
German Climate vs. Japanese Climate
One thing the countries have in common is that they both have four distinct seasons. While Northern Japan is closest to the German climate, temperatures in Central Japan are on average slightly higher and in Southern Japan significantly higher than in Germany. However, the high humidity and rainy season of Japan cannot be found in Germany at all.
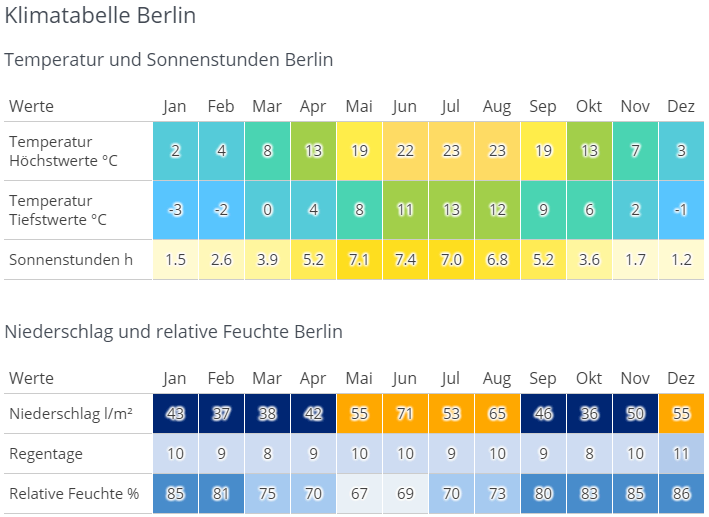
A German-language climate chart for Berlin ("Klimatabelle Berlin") presented as two color-coded tables covering all twelve months. The first table, "Temperatur und Sonnenstunden Berlin," shows three rows: average highs ranging from 2°C in January to 23°C in July and August, average lows from -3°C in January to 13°C in July, and sunshine hours peaking at 7.4 in June. Cells are shaded on a blue-to-yellow gradient so warm months stand out in yellow and cold months in blue-green. The second table, "Niederschlag und relative Feuchte Berlin," covers precipitation in liters per square meter (highest at 71 in June), rainy days per month (mostly 8 to 11), and relative humidity, which is highest in the winter months at 85–86% and lowest in May at 67%. Precipitation cells use a dark-blue-to-orange scale, with the wettest months highlighted in orange.
A German-language climate chart for Berlin ("Klimatabelle Berlin") presented as two color-coded tables covering all twelve months.
The first table, "Temperatur und Sonnenstunden Berlin," shows three rows: average highs ranging from 2°C in January to 23°C in July and August, average lows from -3°C in January to 13°C in July, and sunshine hours peaking at 7.4 in June. Cells are shaded on a blue-to-yellow gradient so warm months stand out in yellow and cold months in blue-green.
The second table, "Niederschlag und relative Feuchte Berlin," covers precipitation in liters per square meter (highest at 71 in June), rainy days per month (mostly 8 to 11), and relative humidity, which is highest in the winter months at 85–86% and lowest in May at 67%. Precipitation cells use a dark-blue-to-orange scale, with the wettest months highlighted in orange.
Visible text in the image
# Klimatabelle Berlin
Temperatur und Sonnenstunden Berlin
| Werte | Jan | Feb | Mar | Apr | Mai | Jun | Jul | Aug | Sep | Okt | Nov | Dez |
| --- | --- | --- | --- | --- | --- | --- | --- | --- | --- | --- | --- | --- |
| Temperatur Höchstwerte °C | 2 | 4 | 8 | 13 | 19 | 22 | 23 | 23 | 19 | 13 | 7 | 3 |
| Temperatur Tiefstwerte °C | -3 | -2 | 0 | 4 | 8 | 11 | 13 | 12 | 9 | 6 | 2 | -1 |
| Sonnenstunden h | 1.5 | 2.6 | 3.9 | 5.2 | 7.1 | 7.4 | 7.0 | 6.8 | 5.2 | 3.6 | 1.7 | 1.2 |
Niederschlag und relative Feuchte Berlin
| Werte | Jan | Feb | Mar | Apr | Mai | Jun | Jul | Aug | Sep | Okt | Nov | Dez |
| --- | --- | --- | --- | --- | --- | --- | --- | --- | --- | --- | --- | --- |
| Niederschlag l/m² | 48 | 37 | 38 | 42 | 55 | 71 | 53 | 65 | 46 | 36 | 50 | 55 |
| Regentage | 10 | 9 | 8 | 9 | 10 | 10 | 9 | 10 | 9 | 8 | 10 | 11 |
| Relative Feuchte % | 85 | 81 | 75 | 70 | 67 | 69 | 70 | 73 | 80 | 83 | 85 | 86 |
What shapes the Japanese weather?
Since Japan spans several degrees of latitude, the climate is influenced by various winds and air currents. So in winter in Northern Japan, you have to prepare for Siberian winds that bring snow and freezing temperatures. In contrast, tropical air currents in summer bring monsoon rains and heat to Southern Japan. Added to this are warm and cold ocean currents in the south and northeast, which further accentuate the differences in climate.
You should also keep in mind that there is generally no drought in Japan. It can rain all year round, with most rainfall in Central Japan and the least in the north of the country.
What are you planning for your stay in Japan?
Winter sports
Hokkaido and the northern regions of Honshu offer tons of snow and world-famous ski slopes for you. Whether you're a beginner or an expert, there's something for everyone!
Beach holiday
You can relax on the beaches of Southern Japan as early as March, especially Okinawa is second to none to other famous holiday destinations like Hawaii. If you mainly want to go swimming, you should avoid the peak summer months, as it can often rain. Only diving or snorkeling is still possible.
Metropolitan Tokyo
Spring and autumn are particularly suitable, as the city heats up extremely in summer and winters can be icy.
Soak up nature
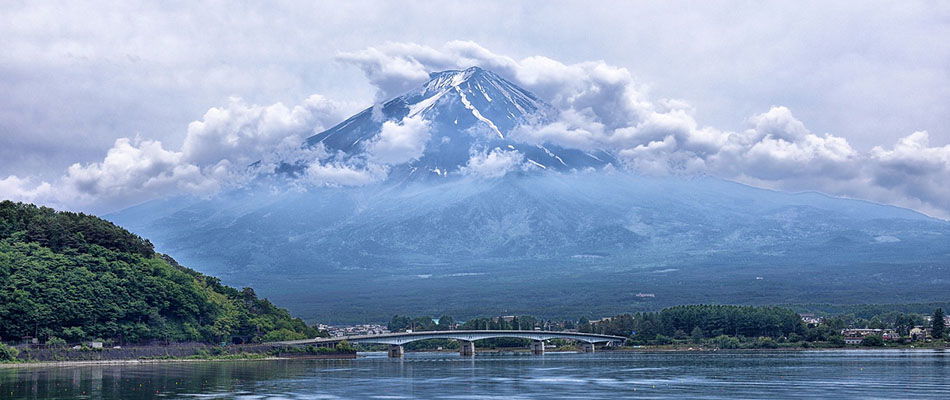
Mount Fuji fills the frame, its snow-streaked summit half swallowed by thick white clouds that drift across the peak and trail down the slopes. The mountain's blue-grey lower flanks stretch down toward a calm lake in the foreground, where a long, low road bridge crosses the water. A densely forested green hill rises on the left bank, and low buildings and trees line the far shore beneath the mountain. It is a classic view of Japan's tallest peak from one of the lakes at its foot, with the spring or early summer snowline still visible above the clouds.
Mount Fuji fills the frame, its snow-streaked summit half swallowed by thick white clouds that drift across the peak and trail down the slopes. The mountain's blue-grey lower flanks stretch down toward a calm lake in the foreground, where a long, low road bridge crosses the water. A densely forested green hill rises on the left bank, and low buildings and trees line the far shore beneath the mountain. It is a classic view of Japan's tallest peak from one of the lakes at its foot, with the spring or early summer snowline still visible above the clouds.
Visible text in the image
No clearly readable text.
Especially for hikers, Hokkaido in summer is recommended, as you can expect breathtaking landscapes and mild temperatures.
Tip for everyone who doesn't like the heat
If temperatures above 30 degrees and high humidity are a nightmare for you, you should avoid summer in Central and Southern Japan completely.
The 4 Seasons
Spring
Nothing shapes Japanese spring as much as cherry blossom season. Every year, tourists flock to Japan to enjoy a sea of white and pink at mild temperatures. Spring is particularly popular among honeymooners!

Summer
Besides beaches and mountains, there are also many different summer festivals to chase away the summer heat - fireworks included.

Autumn
Autumn awaits you with pleasant temperatures and the changing colours of the deciduous trees, which make the country glow in red, gold and orange.
Winter
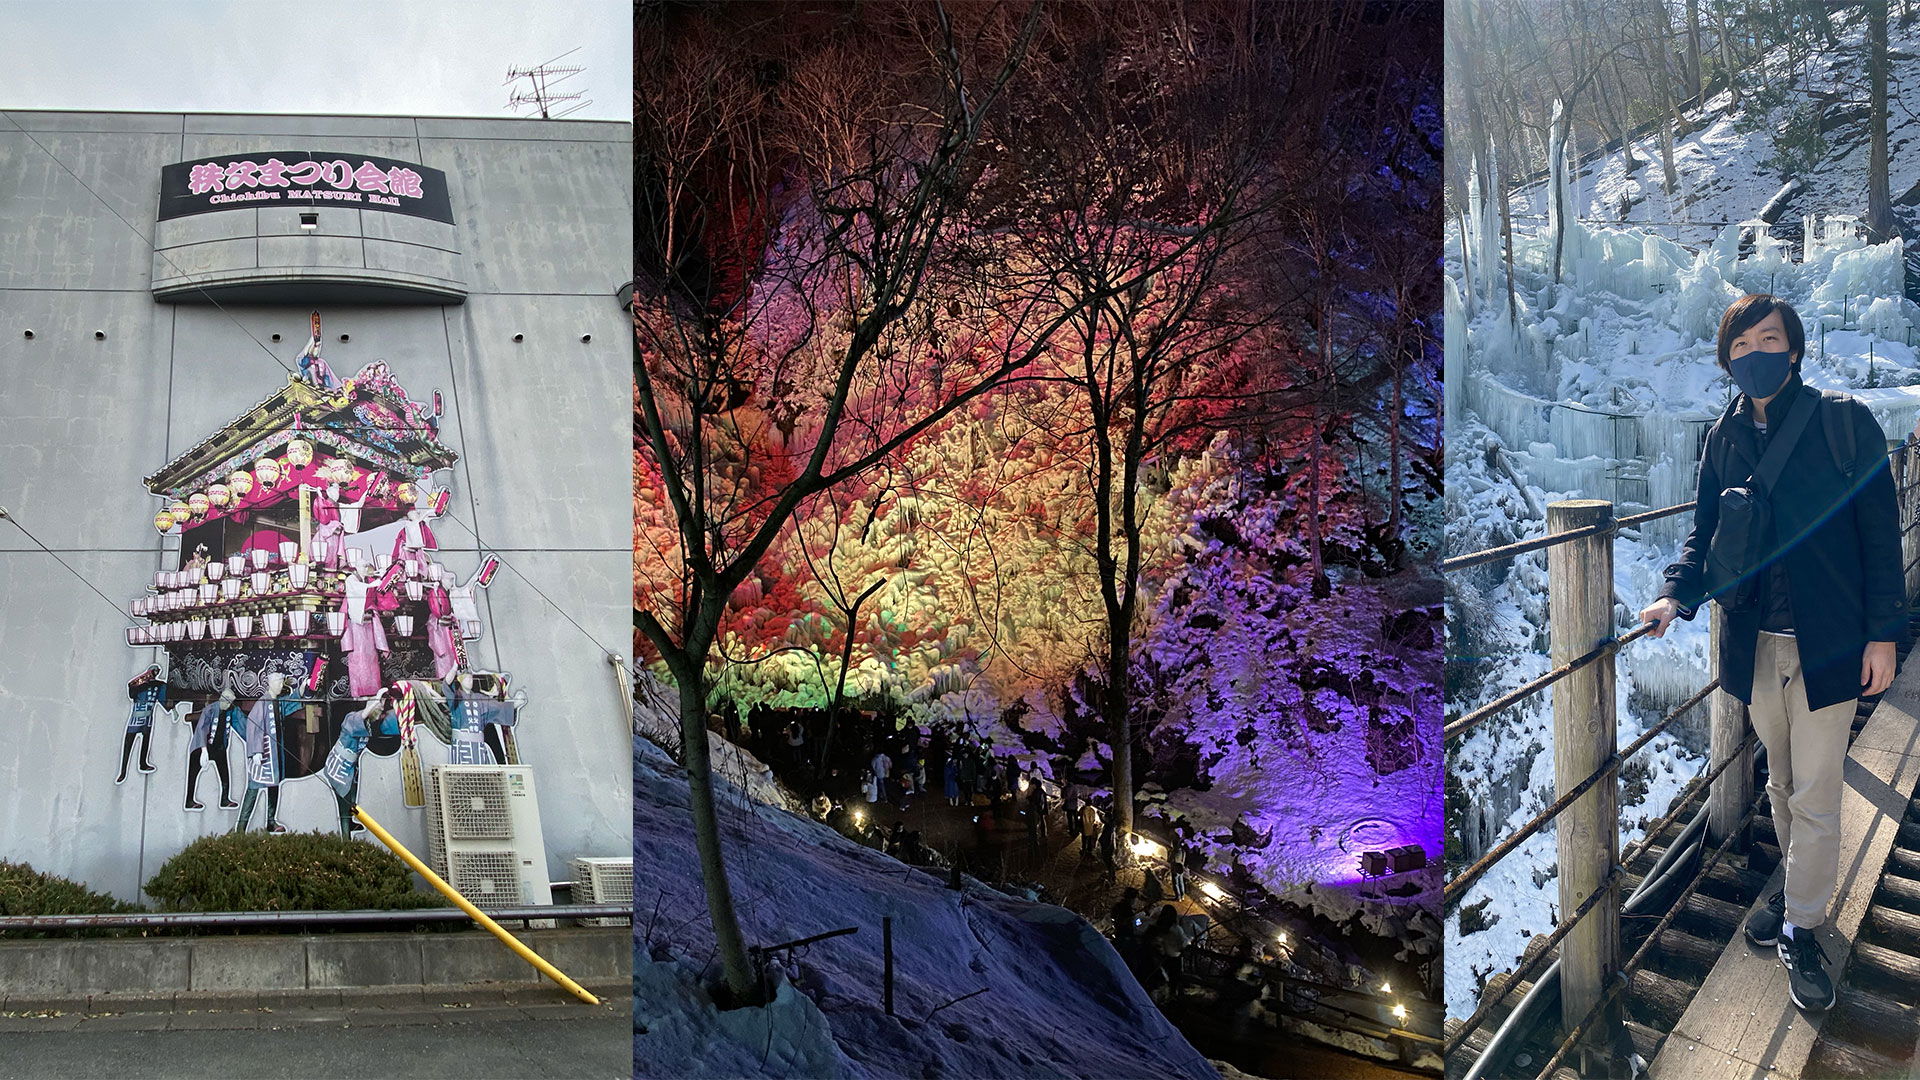
The best time for winter sports enthusiasts, especially skiers and snowboarders get their money's worth. If you prefer a more relaxed pace, you can visit the hot springs (Onsen) or take a walk through the snowy landscapes. The best seafood is also caught in winter.
My personal favorite season
For me, spring and autumn are at the top, because it's not too cold, but not too warm either. Plus, it's usually clear skies, the perfect combination! I compare the Japanese summer to a greenhouse, or even a tropical house at the zoo. It's just uncomfortably hot, humid and oppressive.
Incidentally, unlike in Germany, the transitions between the seasons seem more fluid and not quite as abrupt to me.
Holidays and peak season in Japan
If possible, try to avoid peak season and major holidays! Not only exorbitant prices, but also crowds will put your patience to the test.
Cherry blossoms
The first major highlight on the Japanese calendar is cherry blossom season. From late March to early April, tourists and Japanese alike compete for the most beautiful cherry blossom trees.
Golden Week
In the week from late April to early May, four different holidays are nestled and not a few companies introduce bridge days. During this time, almost all popular holiday destinations are overcrowded with Japanese tourists.
Obon
Many Japanese people travel over this holiday, which falls around August 13th, either to their families in their hometown, or on holiday. Hokkaido and Okinawa are at the top of the list there.
Autumn foliage
Similar to cherry blossoms, autumn foliage is popular. Popular destinations like Kyoto, Hiroshima or even Tokyo are particularly crowded with tourists in late November. If possible, sights should be visited during the week and avoided on weekends.
Year-end
Like Obon, many Japanese travel home for the New Year holidays to spend time with family, similar to Germans at Christmas. Of course, tourism also booms on these days.
Tip: Right after New Year's, you can get some bargains in the end-of-season sale.
Typhoon season
Every year from June to September, typhoon season brings high temperatures and heavy rain. Most typhoons do not hit the mainland directly, especially not in the Tokyo region. The south of the country is far more affected in comparison. But even if strong typhoons are rare, you should definitely check in advance what to do in an emergency. During typhoon season, news and weather reports should continue to be followed daily to avoid any unpleasant surprises.
Conclusion
The question of when you should travel to Japan is difficult to answer. The country is always worth a trip. Every region and every season has its own highlights and there's something for everyone. The best thing is to choose what interests you the most and then base your travel time on that.
Comments
First post to get our bearings. We have already been to Japan once in May, in the region around Tokyo, Kyoto and Hiroshima. It was a wonderful trip. Now we are planning to maybe visit the south sometime. Best regards, Doreen
Hello Doreen, I’m glad to hear that you enjoyed it as well. The south of Japan is also very beautiful, I hope you have just as much fun there! Best regards, Ryusei